What it takes to trust a burn-scar segmentation

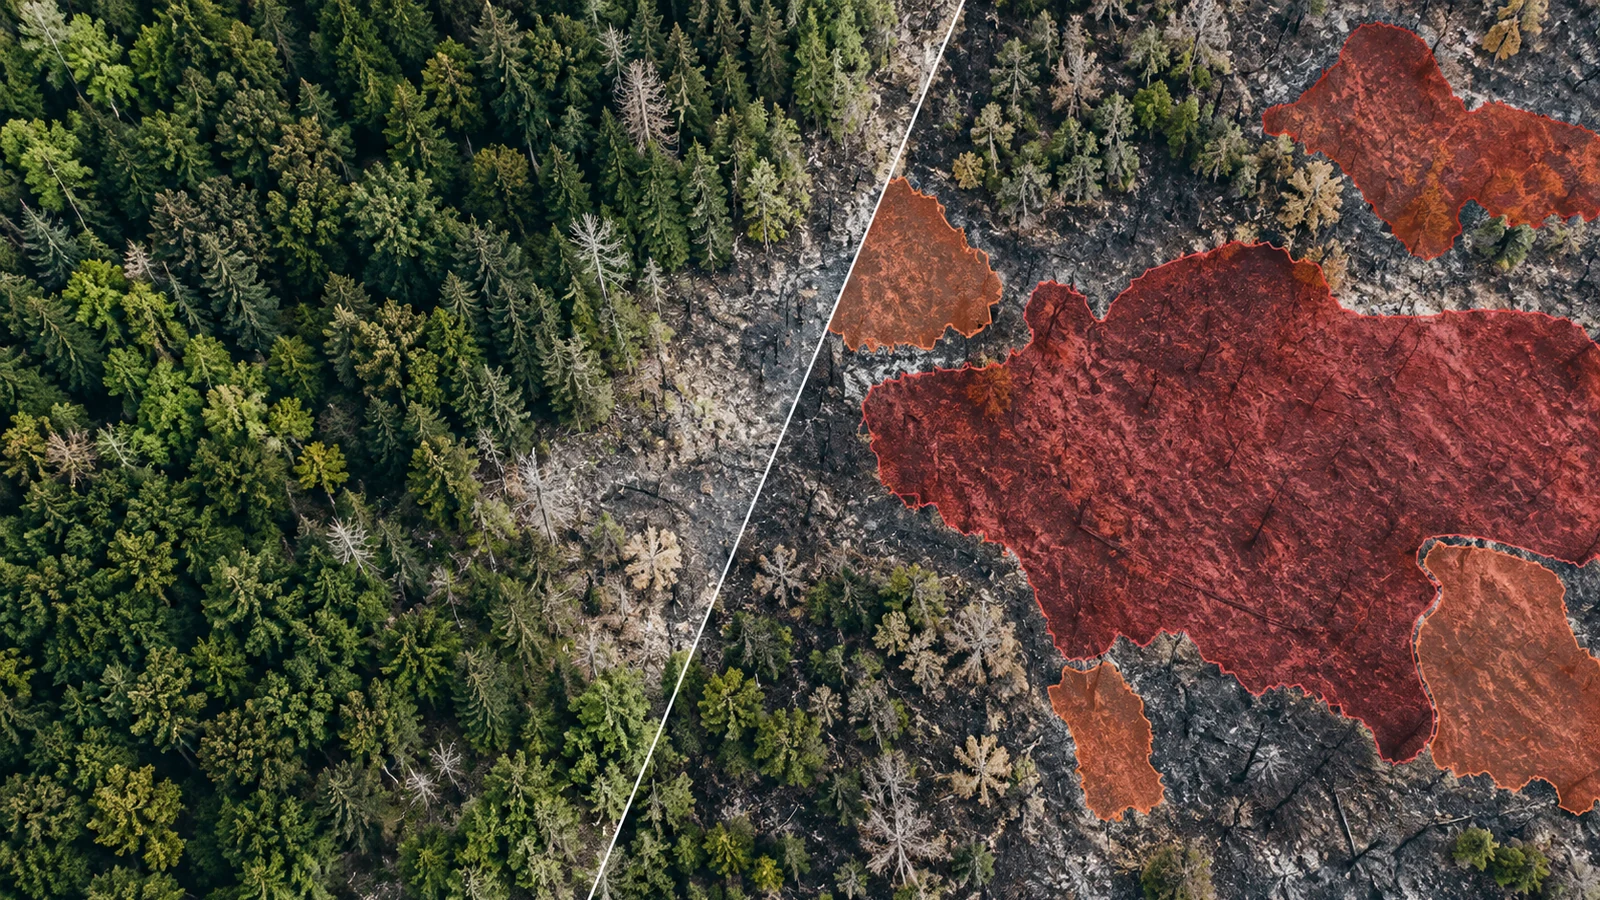
A burn-scar model that scores 0.88 IoU on a benchmark has shown that it reproduces that benchmark's labels on that benchmark's test chips. Whether an analyst can trust its polygon for a new fire depends on things the score does not show: where the labels came from, how the test chips relate to the training chips, and where in each chip the errors fall.
We worked through this on one public dataset, HLS Burn Scars. We ran a spectral-index baseline and checked how the published splits are built. We did not train a model for this post, so it has no learned-model result of our own. The foundation-model numbers below are the ones their authors report.
What the dataset is and how its labels were made
The dataset card describes 804 chips of 512 × 512 pixels from HLS v1.4 S30 (Sentinel-2 harmonised to 30 m), with six bands: Blue, Green, Red, B8A (narrow NIR), B11 and B12 (SWIR). Fires are in the contiguous US, 2018 to 2021, and the licence is CC BY 4.0. Masks are 1 for burn scar, 0 for not burned and −1 for missing data. The card says the 804 files were "randomly split into training (2/3) and validation (1/3)". The Hugging Face loading script has no separate test set: it points its test split at the validation folder.
The Prithvi paper (Jakubik et al., 2023) explains how the labels were built. Perimeters come from the Monitoring Trends in Burn Severity (MTBS) database. For each fire, the authors took "the first HLS image that occurs more than 1 month but less than three months after the start of the fire". A scene was skipped if it had more than 10% cloud or covered less than half the tile. The chip was centred on the scar, and the mask was rasterised from the fire shapefile. Each chip has one post-fire date. There is no pre-fire image.
What we measured after downloading the 2.65 GB archive (SHA-256 matches the LFS pointer):
| Property | Value |
|---|---|
| Chips | 804 (540 in training/, 264 in validation/) |
| Pixel labels, whole dataset | 23,203,821 burn; 186,225,043 not burned; 1,334,912 missing |
| Burn share of valid pixels | 11.1% |
| Burn fraction per chip | min 0.4%, median 4.1%, 90th percentile 28.1%, max 96.3% |
| Pixel values | float32 surface reflectance on a 30 m UTM grid |
Half the chips have less than 4.1% burned pixels. On those chips a few dozen pixels of boundary disagreement can swing the chip's IoU by a large amount.
Baseline: one threshold on post-fire NBR
With only post-fire imagery you cannot compute dNBR, the pre/post difference MTBS analysts work from. You get single-date NBR = (B8A − B12) / (B8A + B12). That means you can't tell "burned this season" from "dark and dry for other reasons": bare soil, rock, urban surfaces, senesced grass and older scars.
We used the train/val/test lists published with Prithvi-EO-2.0-300M-BurnScars (524/160/120 chips), which the model card calls "new non-overlapping splits". We chose the threshold on training pixels only, taking the value that maximised pooled burn IoU. The same threshold also maximises F1, because F1 = 2·IoU/(1 + IoU). Then we applied it unchanged to the 120 test chips. The script is numpy only and reads the TIFFs straight out of the tar stream:
python -I scripts/quick_nbr.py data/hls_burn_scars.tar.gz data/prithvi_splits \
    results/nbr_baseline.json figures
# M1 Pro, Python 3.12.8, numpy 1.26.4: 40 s wall clock, one pass over the archive
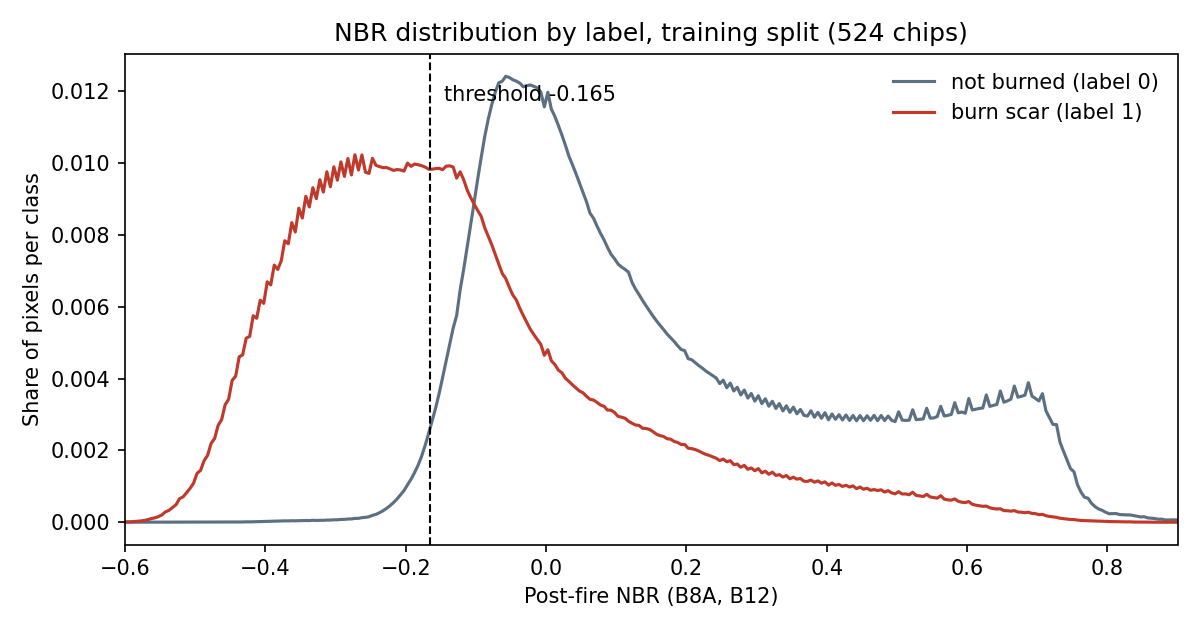
The chosen rule is burn where NBR < −0.165. The histogram shows the problem: a long tail of pixels labelled burned have NBR well above zero, the same range as healthy vegetation. Some will be low-severity burns. Others are probably unburned islands inside the MTBS perimeter (see the label section below). No threshold can split those from their unburned neighbours.
| Split (test chips) | Burn IoU | Burn F1 | Precision | Recall | Background IoU | Pixel accuracy |
|---|---|---|---|---|---|---|
| Prithvi-EO-2.0 test (120) | 0.476 | 0.645 | 0.821 | 0.531 | 0.935 | 0.939 |
| Original random validation (264) | 0.463 | 0.633 | 0.749 | 0.548 | 0.938 | 0.941 |
Pixel accuracy is 0.94 while burn IoU is 0.48. Most valid pixels are unburned, so accuracy and mean IoU over both classes flatter any method. Report burn-class IoU and F1, and precision and recall separately. On this split the threshold is conservative: when it says burned it is usually right (0.82), but it finds only about half of the labelled area.
The pooled number hides the chips that fail
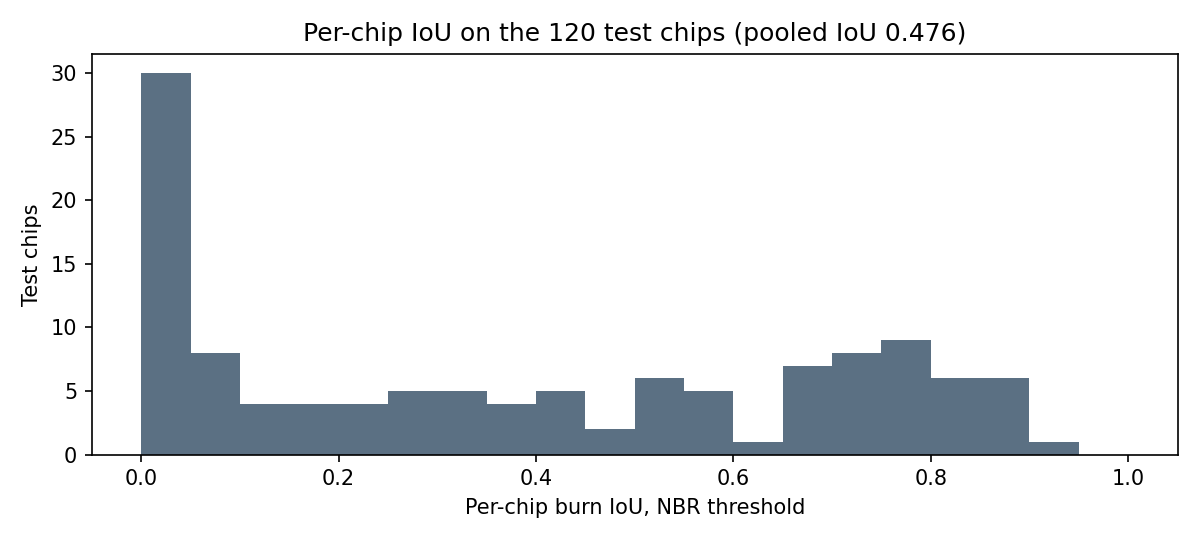
Pooled IoU counts every pixel once, so a few large fires dominate it. Per-chip IoU on the same 120 test chips tells a different story:
| Per-chip burn IoU (NBR, 120 test chips) | Value |
|---|---|
| 10th percentile | 0.00 |
| 25th percentile | 0.05 |
| Median | 0.36 |
| 75th percentile | 0.70 |
| 90th percentile | 0.82 |
| Chips below 0.5 | 71 of 120 |
A pooled 0.48 sits on top of a split distribution: some fires are mapped well and many are missed almost entirely. The five worst test chips all score exactly 0. All five are small scars (0.9% to 5.9% of the chip), almost all of the error is missed burn rather than false alarms, and they sit in MGRS tiles 13SEA, 15RVQ, 15SXB (two dates) and 16SBA, which lie between 108° W and 84° W and between 24° N and 40° N: the southern Rockies' eastern edge across to the south-central and south-eastern states. Image dates run from April to July. Our guess is spring prescribed burns in grass or pine understorey that greened up before the HLS date fell inside the one-to-three-month window. We did not render these chips, so treat that as a hypothesis. Checking it means plotting SWIR2/NIR/Red composites next to the masks and looking up each fire's MTBS incident type.
We also measured where the errors fall. Only 10.9% of the baseline's wrong pixels lie within 2 pixels (60 m) of the label boundary. The rest are whole regions: interiors missed and patches flagged outside the perimeter. For a threshold, the boundary is not the main problem. For a learned model the share near the boundary would probably be higher, and that is the number we would want before trusting its polygons.
Published foundation-model numbers on the same data
These are reported by the model authors. We did not reproduce any of them.
| Model (as reported) | Split and setup | Burn IoU | Other reported metrics |
|---|---|---|---|
| Prithvi-EO-1.0-100M, model card | Split not described on the card | 0.73 | Overall accuracy 0.96 |
| Prithvi 100M pretrained, Jakubik et al. Table 3 | "Test set"; the paper fine-tunes on 540 images, which matches the original random training folder | 73.62 | F1 burn 84.81, mIoU 84.84 |
| U-Net (DeepLabV3) baseline, same table | Same | 71.01 | F1 burn 83.05 |
| Prithvi-EO-2.0-300M, Szwarcman et al. v3 Table V | 120-chip test split (per the model card, the same lists), chips resized to 448, UPerNet decoder, 10 seeds | 79.9 (±0.8) | mIoU 88.6 |
| Prithvi-EO-2.0-600M, same table | Same | 83.2 (±1.1) | mIoU 90.5 |
| Prithvi-EO-2.0-300M-BurnScars, model card | Non-overlapping 524/160/120 split (the one used above), UNet decoder, best of 5 runs by validation loss | 87.52 test, 84.28 val | Test mIoU 93.00 |
| NBR threshold (this post) | Same 120 test chips, threshold fitted on train | 47.6 | F1 64.5 |
Three cautions for reading this table. The rows use at least two different splits plus one undescribed one, so they are not one leaderboard. The 87.52 comes from picking the best of five runs by validation loss, which is a fair procedure but reports a good run, not a typical one; the paper's 79.9 is a ten-seed mean with a different decoder. And the paper's "aggregated F1" of 97 to 98 is not a burn-class F1. The same paper calls its flood F1 micro-averaged, and a micro-averaged F1 over both classes equals pixel accuracy.
What the table supports: on the 120-chip test split, a fine-tuned foundation model recovers far more of the MTBS-labelled area than a post-fire index can. It does not tell you how much of that gap a small U-Net trained from scratch would close. The 2023 paper's U-Net row (71.01 vs 73.62) suggests much of it, on the older split, but we could not check that here.
Are train and test chips independent?
Burn scars are spatially clustered, and a chip is a 15 km window. If test chips overlap training chips, the test partly measures memory. We checked overlaps between chips in the same MGRS tile, where chips share a CRS and pixel grid so the offset is exact:
| Split | Test chips overlapping a training chip | Test chips whose labelled burn pixels also appear in a training mask | Share of test burn pixels already labelled in training |
|---|---|---|---|
| Original random (264 validation chips) | 73 | 16 | 0.6% |
| Prithvi-EO-2.0 (120 test chips) | 0 | 0 | 0% |
This is a lower bound. Chips in neighbouring tiles of the same UTM zone can overlap too, and we did not check those. The Prithvi-EO-2.0 lists do what the card says, at least within tiles. On the original split, more than a quarter of validation chips share ground with a training chip, but only 0.6% of the validation burn pixels sit under a training label. Most of the overlap is unburned background and neighbouring fires.
The NBR threshold barely notices the difference (0.476 vs 0.463), as expected: one fitted parameter cannot memorise a place. A network with millions of parameters can learn local land cover and soils, so the split matters more for it. Non-overlapping chips are still not geographically independent. A test fire 20 km from a training fire in the same ecoregion shares fuels, soils and sun angle. For a claim about new regions, hold out whole regions (ecoregions, states or MGRS latitude bands) and report per-region scores.
What else decides whether a result can be trusted
Label provenance: perimeters include unburned islands
MTBS analysts digitise a perimeter "to include any detectable fire area", working mostly on Landsat imagery and NBR/dNBR at display scales of 1:24,000 to 1:50,000 (MTBS mapping methods). An independent accuracy assessment of MTBS on shrub-steppe fires found commission errors of 4.3% to 15.5%, "primarily due to inclusion of unburned islands and fingers within the fire perimeter". A model that maps the unburned islands correctly is scored as wrong there, so the ceiling on burn IoU against these labels is below 1. We found no estimate of how far below for this dataset. MTBS also maps only fires of at least 1,000 acres in the West and 500 acres in the East (project overview), so a smaller fire inside a chip is not in the labels, and a model that finds it is scored as a false positive.
Temporal mismatch: label date and image date differ
The perimeter is drawn on MTBS's own Landsat pair. The HLS chip is a different sensor on a different date, one to three months after ignition. Grass can green up within weeks. Snow, harvest and later fires can change the scene too. The label describes the fire. The pixels describe the ground on one later day.
Alignment: v1.4 co-registration is not quantified
HLS v1.4 relied on an in-house reference and AROP for co-registration. NASA says v2.0 replaced these with the Sentinel-2 Global Reference Image, which "substantially improves the geolocation accuracy" (HLS spatial co-registration). In v2.0, S30's 20 m SWIR bands are area-averaged to 30 m; we could not confirm the v1.4 method. Neither page gives a residual misregistration figure, so a one-pixel offset between the MTBS perimeter and the HLS grid is plausible but unmeasured.
Resolution: 30 m pixels and small fires
At 30 m, one pixel of disagreement along a 10 km perimeter is about 0.3 km² of burned area. For small fires, where the perimeter is long relative to the area, that cost is a large share of the IoU. Report boundary-tolerant scores (boundary F1 at 1 to 2 pixels) next to IoU.
Validation design: keep the test chips untouched
Fit thresholds and select checkpoints on validation chips, never on test chips. With the original release you have to carve a validation set out of training/ yourself, because the loader's test set is the validation folder. Report seeds and spread, not the best run.
What this test does not establish
It does not show how a learned model does on this data, because our U-Net run never happened. The comparison table pairs our baseline with numbers we did not reproduce. It says nothing about fires outside the contiguous US, outside 2018 to 2021, or in the other HLS product (L30). It does not measure the MTBS label error on these chips, so neither our scores nor the published ones can be separated from label noise. The overlap check covers same-tile pairs only. Our reading of the zero-IoU chips is a hypothesis until someone renders them.
The next test we would run: the same compact U-Net trained on the Prithvi split and again on the original random split, both scored on per-chip IoU and boundary F1. Then hand-check 20 worst chips against post-fire imagery to estimate how many "errors" are label errors.
Sources
- Phillips, Roy, Ankur, Ramachandran. HLS Foundation Burnscars Dataset, Hugging Face, 2023, doi:10.57967/hf/0956, CC BY 4.0
- Jakubik et al. Foundation Models for Generalist Geospatial Artificial Intelligence, arXiv:2310.18660, 2023
- Szwarcman et al. Prithvi-EO-2.0: A Versatile Multi-Temporal Foundation Model for Earth Observation Applications, arXiv:2412.02732 v3, March 2026
- Prithvi-EO-1.0-100M burn scar model card
- Prithvi-EO-2.0-300M-BurnScars model card, config and splits
- MTBS project overview and mapping methods
- Sparks et al. An accuracy assessment of the MTBS burned area product for shrub–steppe fires in the northern Great Basin, International Journal of Wildland Fire 24
- NASA HLS spatial co-registration